
PotlatchDeltic is a timberland real estate investment trust (REIT) with geographically diverse, high quality, productive timberlands. With the highest leverage to lumber among the timber REITs, we are the best play on the housing recovery. Our strong balance sheet provides capital flexibility to grow shareholder value.
Our timberlands are uniquely positioned to leverage favorable market conditions and our wood products facilities are efficient and well funded. Our real estate business maximizes value through land stratification.


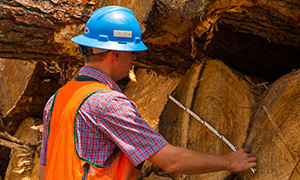
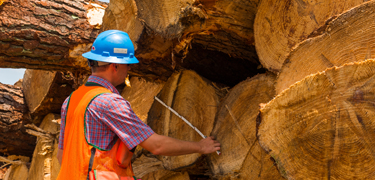
Explore our timberlands.
Camp. Hunt. Play.

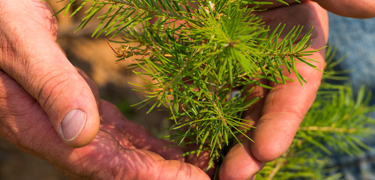
Sustainability is central to our business model. We believe corporate stewardship is not only the right thing to do, but also crucial to securing the future of our industry and our leadership position in it.
Part of the solution to climate change
Committed to social responsibility
Committed to responsible governance


Explore career opportunities to join our team. We offer comprehensive benefits and tools to help you build your career.